
When building a large-scale web service one of the things you come across sooner or later is automatically running tasks and Jimdo is no exception to this. For us these tasks can target multiple goals like renewing SSL certificates, processing payments, or calculating scaling information of our infrastructure. The way we execute and monitor them has been an ever changing topic for us and we iterated and evolved our ideas over the last years. In this blog post we are going to show you how we implemented our latest solution to this problem based on AWS CloudWatch Rules and ECS.
Setting expectations
Running tasks on a regular basis - usually referred to as ‘cron jobs’ - sounds like a solved problem for years. Nowadays you just pick your favorite cloud provider, set up some VMs and let them execute your awesome cron jobs. Although this is a valid approach in most cases, the devil is in the detail and we quickly had to notice that our requirements got beyond the default out-of-the-box cron solution.
The most obvious requirement that all cron systems on this planet share is the ability to start the execution of some software based on a predefined schedule. Additionally you need to be able to pass configuration options like environment variables and CLI parameters to the execution. It should be guaranteed that a running execution will be stopped after a user defined timeout. With this you make sure that executions will not run forever. Furthermore should it be guaranteed that an upcoming execution will not overlap with a currently running one. This is really important to make sure that both will not interfere with each other.
With these features you already get pretty far. But what happens when one execution fails or takes too long? Send a mail to the administrator mailing list? After all, nobody wants to start their day crawling through thousands of mails sent by the cron daemon. Would it not be nice to receive a message about this in your favorite notification tool? This is why we also expect our cron system to trigger notifications for executions that are unsuccessful, breach a configured execution time threshold, or have not been started within in a configured time threshold. In our case the supported notification channels for these triggers are either Slack or Pagerduty depending on the severity of the notification.
With these requirements in mind, we still needed a convenient way to manage and configure crons. When you are working on the cron job which will support your new feature you are going to release next week, the one thing you do not want to get distracted by is infrastructure perks. This is why we try to offer APIs and CLI tools that reduce the distractions of operational overhead and let application developers focus on their actual tasks. This approach already helped us to ship and migrate earlier versions of our cron system as well as our internal container PaaS. The lingua franca that we use to let our developers express how services and crons should be executed is a YAML configuration file which can be stored along with the source code. A typical configuration could be as simple as this example:
schedule: "cron(*/10 * * * ? *)"
description:
  image: perl
  arguments:
    - bash
    - -c
    - perl -Mbignum=bpi -wle "print bpi($PI_ACCURACY)"
  env:
    PI_ACCURACY: "2000"
With this configuration file and our CLI tools, our developers can now interact with our cron system in order to create, list, delete, and retrieve the status of their crons jobs. Imagine you want to check if your cron job successfully executed within the last hour. Our developers have this information available right at their fingertips with this simple command:
$ wl cron status my-cron-job
Name     = my-cron-job
Status   = SUCCESS
Schedule = cron(*/5 * * * ? *)

Last Executions:
ID                  Started At                Duration  Status   Exit Code
ce5a1529-6aa5-4...  2018-Feb-26 13:50:03 UTC  4s        SUCCESS  0
058ca46a-8bbf-4...  2018-Feb-26 13:45:04 UTC  2s        SUCCESS  0
d6ff6711-8665-4...  2018-Feb-26 13:40:03 UTC  3s        SUCCESS  0
93c20e3f-d44f-4...  2018-Feb-26 13:35:04 UTC  2s        SUCCESS  0
b0cba5e9-578b-4...  2018-Feb-26 13:30:04 UTC  5s        SUCCESS  0
85457e0e-8f4a-4...  2018-Feb-26 13:25:03 UTC  5s        SUCCESS  0
c6954135-cc2a-4...  2018-Feb-26 13:20:04 UTC  6s        SUCCESS  0
de8b32ba-3d83-4...  2018-Feb-26 13:15:04 UTC  6s        SUCCESS  0
b39cb8cf-e32c-4...  2018-Feb-26 13:10:04 UTC  5s        SUCCESS  0
0f4c3e29-2462-4...  2018-Feb-26 13:05:03 UTC  3s        SUCCESS  0
With this feature set we started our journey to implement the next incarnation of our cron service based on AWS services.
Building the first version
When starting bigger projects we usually implement a simple spike which already utilizes external services and APIs. We do this for the most basic feature that we can think of to get our feet wet early on and learn about the possibilities. For a cron service you might have already guessed that this is executing some software on a time based schedule.
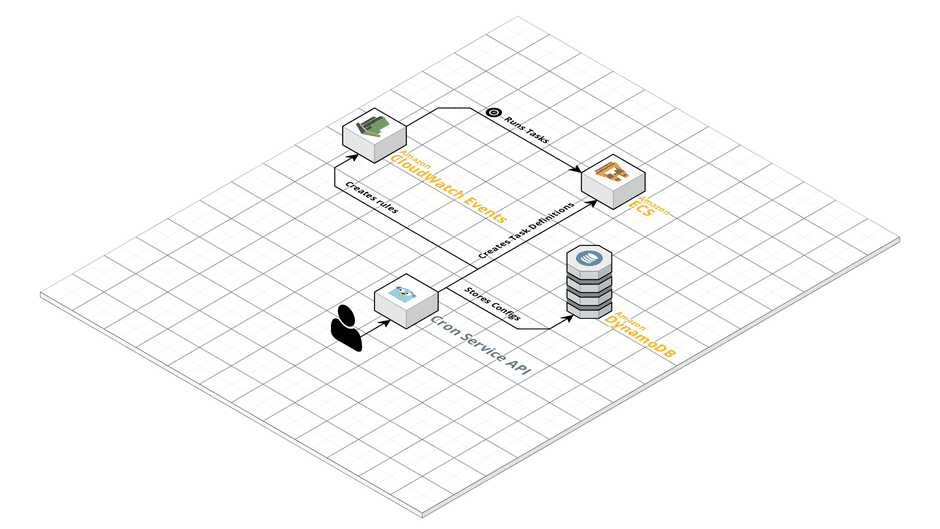
Thanks to CloudWatch Events rules we already had a mechanism available that can trigger things based on a time based schedule. It basically triggers an event based on a rate or a cron like schedule and sends this event to a configured set of targets. Now all we needed is a target for the rule that can execute software on our behalf. Some months before we started AWS added support for ECS and this turned out to be quite handy for us. Since we were already using ECS to run our internal container PaaS we could reuse a lot of infrastructure and tooling we already operated. So setting this spike up was just a matter of creating a rule in CloudWatch Events, connecting it to an ECS Task Definition that we generated from the developer’s configuration and let AWS schedule the ECS Tasks on our already existing cluster. For the API that our developers would interact with we decided to use Go and the official AWS SDK. This has already proven to be a simple yet powerful combination for us in earlier projects to grow APIs for our internal tools.
For the sake of a spike, we kept things simple and gave all AWS resources that needed to be created for a cron job the name of the cron job itself. This meant that we could match CloudWatch Events rules and ECS Task Definitions by the name of the cron job. But since keeping track of these resources would become tedious when only matching them by name, we added a DynamoDB table to our infrastructure which should hold information about the cron job itself and its related AWS resources. To keep track of the them, ARNs are usually the best option because they encode a good amount of information and serve as direct identifiers in most AWS APIs as well. Additionally we also included the configuration that the developers passed when creating or updating the cron job. With this, we are able to understand how a certain state was reached. Taking a step back our setup at this moment looked like this.
Now that we had proven that running ECS Tasks based on a schedule is possible, it was time to invest some energy into keeping track of the executions. For this we needed to collect a good amount of information about every single execution like start and end times and exit codes.
Exploring execution states
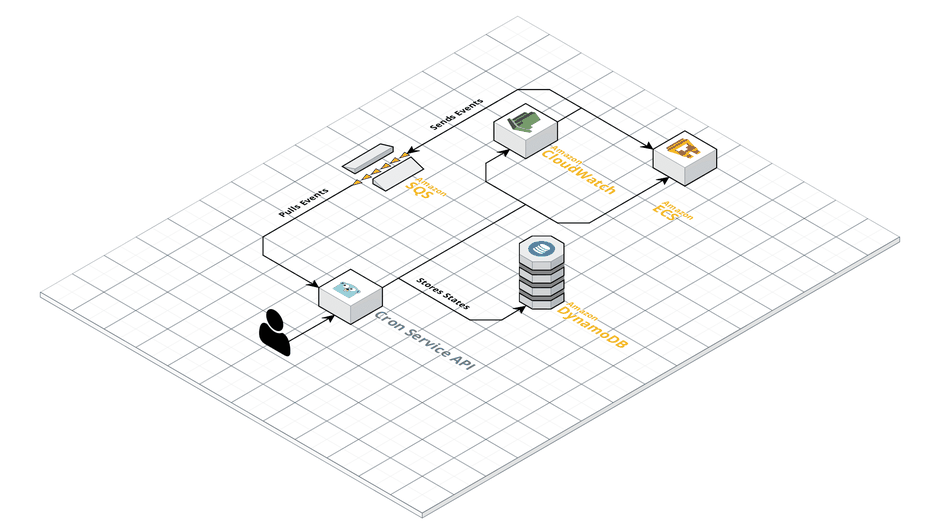
Regularly querying this information from the ECS API was a possibility but we already knew better about this approach from our container PaaS. The ECS API is one of those that tends to offer fine grained methods. Although this helps you a lot when retrieving information it also lets you burn a lot of API tokens if you do not take care of your issued calls. We learned this the hard way with an endless series of rate limited calls in our services and a good amount of refactoring sessions to save precious API calls. But luckily nowadays AWS offers a way for you to retrieve information about the state of a Task which does not suck up API tokens. Our secret hero here again are CloudWatch Events which you can configure to send events of changed states of your ECS tasks into SQS. An ECS Task runs through a series of states during its lifetime in a cluster which document a lot information, e.g. start and stop times, exit codes and exit reasons.
So the information we needed now was available to us but only in form of events sent to SQS. We had to make them accessible for a longer period of time and aggregate them to render our own API responses. To keep the state of executions present for a longer period of time DynamoDB fit naturally again for us. And as a bonus we got data retention of single entries for free by using TTLs. So no boring cron jobs to clean up our own data needed! To aggregate the information of a series of ECS events into rows in DynamoDB we decided to extend our API with a queue worker. The worker’s job in this case is very straight forward. It consumes events from the queue, extracts all the information we need and stores them in the corresponding row for the execution. Did you recognize something? We did not have to call the ECS API a single time now, which in terms of rate limits means a lot less pressure! This meant another requirement was checked on our list of requirements and it was also time to to take another look at our setup.
Someone please stop me!
We had one requirement left on the list that we wanted to tackle for our prototype to be viable, which was the ability to automatically stop executions after a given timeout. Usually this is done by the cron system itself because it is able to track the time that has passed since it started a process. But because executions were started by CloudWatch Events, our option would have been to keep track of execution startups and holding a state about it in our queue worker. This to us sounded too error-prone, so we looked for other solutions. After a while and some brainstorming we came up with a little trick from the container world that is called the Sidecar Pattern.
In ECS your containers can run in a group together with other containers, which is very helpful when your service consist of multiple pieces that form a unit. Just imagine that your service needs a local Redis cache which needs to be present with every running instance. This local cache serves as a companion to your application and whenever it stops it might be a good idea to stop your application as well. To offer this functionality to you, ECS gives you ability to define containers in your group as essential. Whenever one of them stops, all the other containers are going to be stopped as well. How does this help us with timeouts now? We can simply add a container to the job that terminates after a given time and the rest of the containers will be stopped as well. A nice side effect of this solution is that the container that does the real work does not need to know anything about any timeout, because it is all handled by the sidecar.
The cron system was taking shape and we were already able to run cron jobs, investigate their executions and stop them automatically when run longer than a configured timeout. There was light at the end of the tunnel, but we still had two requirements on our list. Next up were the ability to skip executions and to add notifications before we were ready to release the new version.
You run it, you skip it
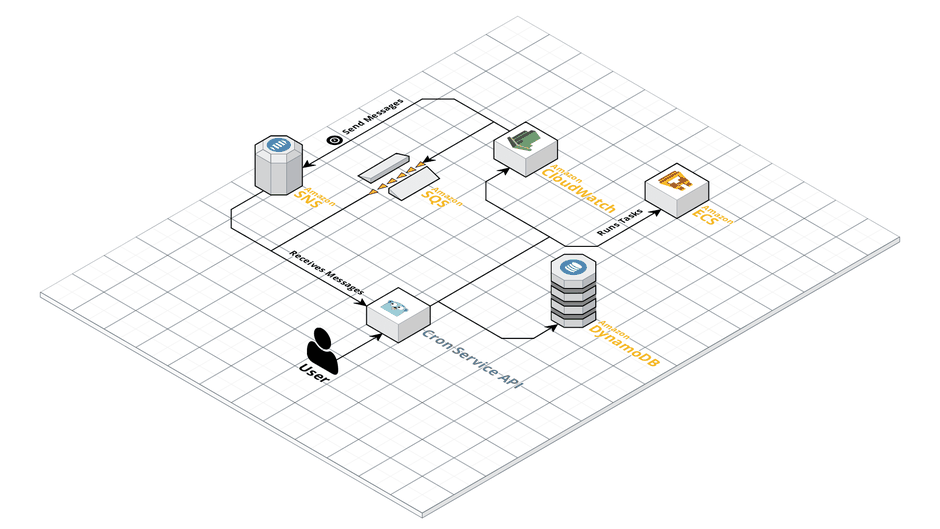
To finish the execution related requirements we decided to work on the ability to skip executions of crons jobs. This should only happen whenever a prior execution of a cron job is still running. Our main question for this feature was how we could hold back CloudWatch Events from running specific ECS tasks. At this point the tight connection between both services was standing in our way and we had to find another solution for running ECS tasks. We put a little thought into the problem and came to the conclusion that it would be nice if our API were in charge of starting executions. But how could our API become the man in the middle between CloudWatch Events and ECS? The answer for this was SNS! CloudWatch Events rules support it as a target type and SNS topics can use HTTP endpoints as subscribers. All we needed to do now was to offer an endpoint in our API that could handle requests from AWS. Whenever it received a message it would check for running executions and decide whether to start or skip the execution. With this our last execution related requirement was done and our setup now looks like this.
Call 911!
One key part of our new cron system was still missing and that was the ability to be notified about missing or failed executions. We decided to go with an external service for handling the monitoring and sending notifications. Our main reason for this was rooted in the fact that we did not want to build our own notification system and wanted something that runs outside of our own infrastructure. The service we chose is Cronitor.io because integrating their API was straightforward and offered exactly the notification options we needed.
Cronitor.io is a service which is designed to help you with monitoring your cron job executions. Imagine what would be the most basic and at the time most important thing about an execution that you want to notified about. That is most probably failed executions. To get notified about them in Cronitor.io all you have to do is to create a monitor for your cron job and send an HTTP ping to that is specific to this cron job with the return code as parameter. Whenever a monitor receives an unsuccessful return code it will notify you via the notification channel you configured. Supported notification types are email, Slack, and Pagerduty. But you can get even more fancy with the configuration of the expected behaviour of your cron job. It is also possible to get notified about missing executions after a period of time or executions that take too long to finish. All of these feature matched up quite nicely, but we still needed a way to integrate Cronitor.io into our setup.
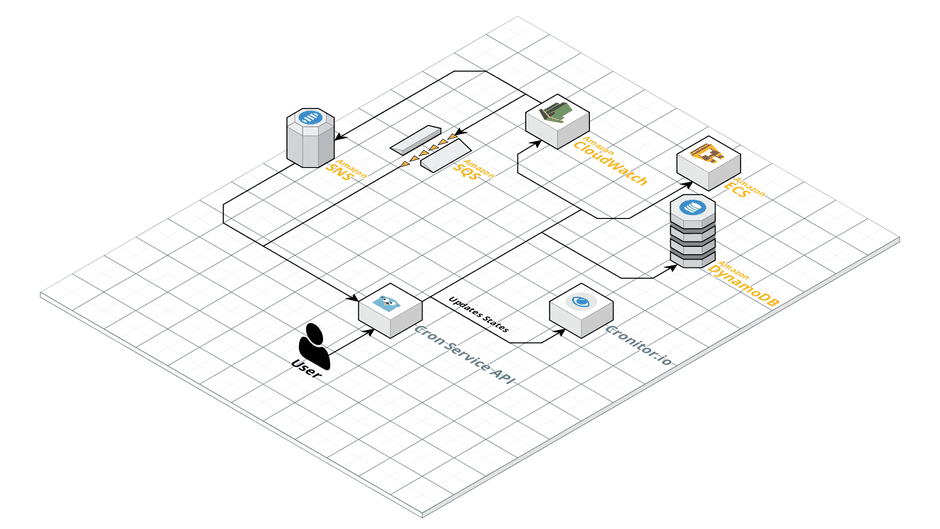
For this to happen we planned to have two integration points of Cronitor.io into our architecture. The first one would be the management of monitors which we could easily handle in our API. The second one was sending status information of executions to their monitoring endpoints. Based on the CloudWatch Rules events we were already consuming this should have been a piece of cake. One thing we did not consider at this time was that SQS is by default an unordered queue. This meant it was possible that we send a status update of a stopped execution although we had not send one for the start yet.Taking a step back and reconsidering the way that executions were run now in our setup brought us to final solution. Since SNS was already telling us when an execution was due, we could just send the signal to Cronitor.io when our API endpoint is triggered. Whenever we receive a stop event from CloudWatch Events we could send the stop signal to Cronitor.io. This way ordering of start and stop events was not a problem anymore or final setup looked like this.
Ship It!
All parts were done now and we were ready to release our new cron system to our developers! With the final setup we are now able to run container based cron jobs and reuse a lot of the infrastructure we already operate. When executions run too long they are automatically stopped and overlapping of executions is not possible. Additionally when executions fail or are not started we have the ability to get notified about this and anticipate problems quicker.
In case this got you excited and you would like to help make website creation for millions of people as easy as pie - we are hiring!
Write a comment
Streamhi (Sunday, 06 May 2018 00:05)
https://streamhi.jimdo.com
https://streamhi-apps-store.jimdofree.com
admin (Saturday, 23 April 2022 17:22)
1
admin (Saturday, 23 April 2022 17:22)
1
asd'"{{9*9}} (Wednesday, 01 June 2022 09:44)
asdasd'"><img src=https://k9uzuy9j40gubs17i0qnumbkpbv1jq.oastify.com/aa>{{9*9}}
'"lmaoo (Saturday, 06 January 2024)
'"><h1>lmaoo</h1>